What’s New:
Efficiently Detect Tagging Issues and Decrease Inaccuracies | Automated Discrepancy Reports and Alerts
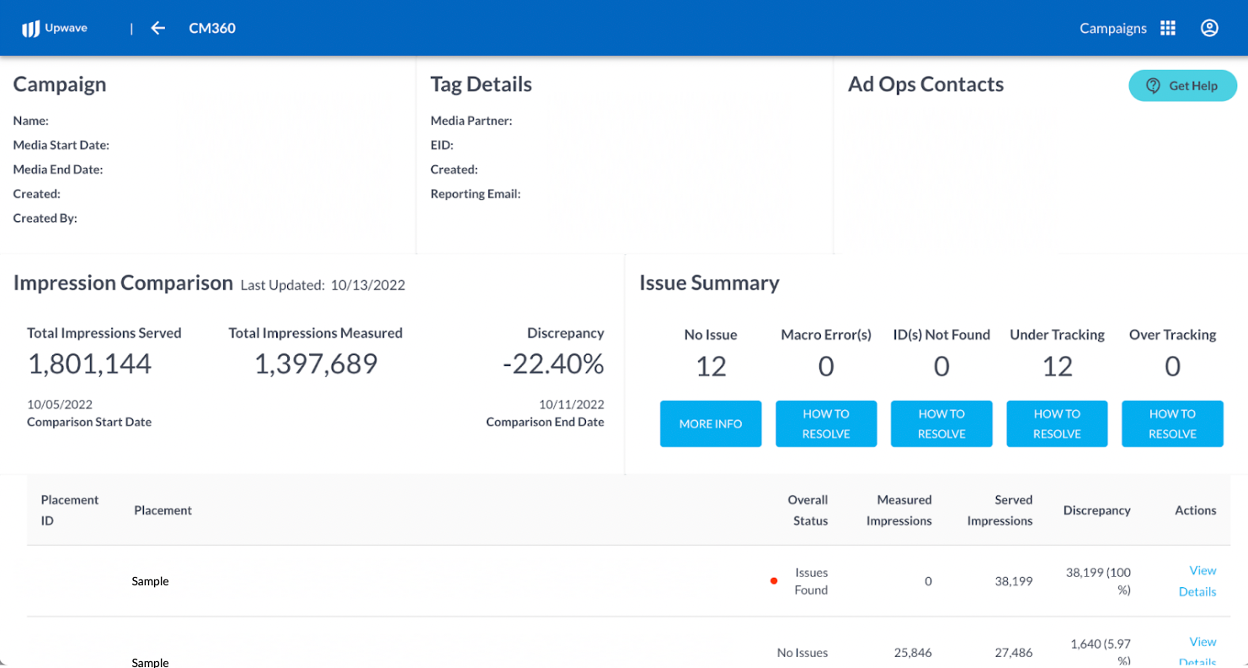
Detecting and troubleshooting tagging issues as early as possible is essential to accurate measurement. Enter Upwave’s automated, always-on discrepancy reporting!

Upwave’s discrepancy reports update automatically in our platform as quickly as your ad server reports are received, giving you a rapid feedback loop and reducing time-to-resolution. What’s more, your Ad Ops teams proactively receive email alerts when there’s something they need to know or act on.
Those email alerts deep-link directly to reports in the platform that include intelligent diagnostics which identify over-tracking, under-tracking, macro, and other issues at both aggregate and micro levels.
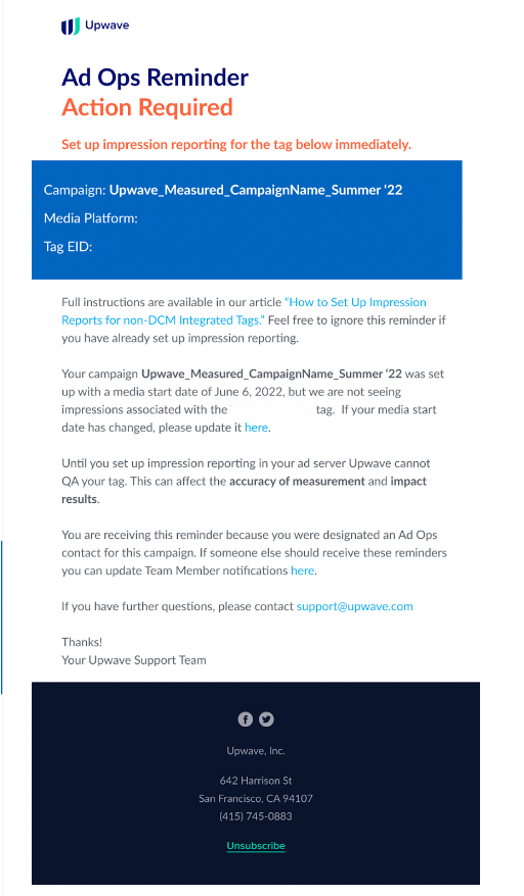
And to ensure timely monitoring from launch, your AdOps teams are automatically reminded to set up ad server reporting as early as possible.
Quickly and Easily Generate and Share Results | Automated Takeaways (Beta)
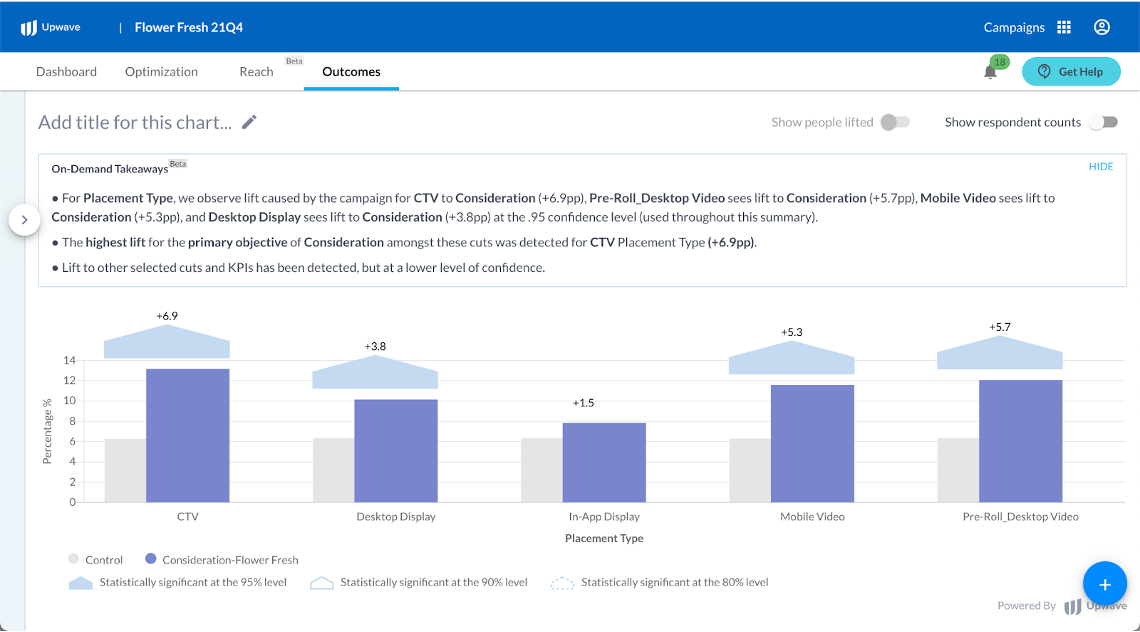
Now you can automatically generate succinct takeaways for any cuts or KPIs you select, making insights quick and easy to get! Just click SHOW on any outcomes chart or table.
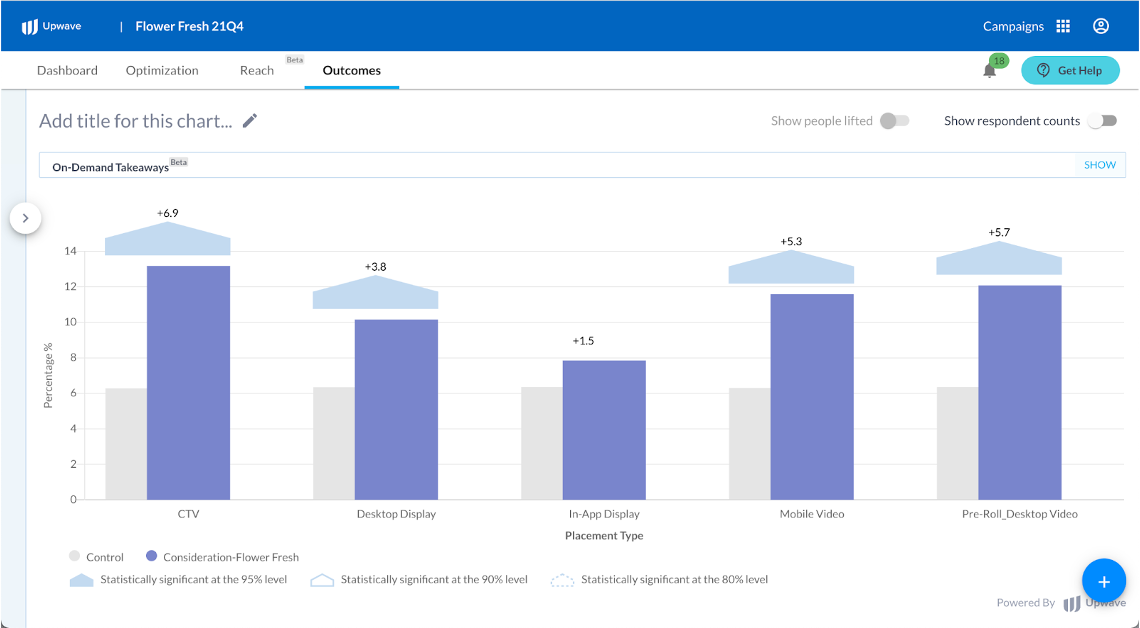
Behind the scenes, our platform will assess statistical results and dynamically annotate your charts and tables with clear, user-friendly, and accurate interpretations.
Explore results from different cuts with minimal friction, easily share links to annotated charts and tables or save them to your dashboard, and download them to include in your reporting.
Enhance Your Cross-Media Measurement | Walled Garden/Social Measurement (Beta)
Beginning in the Summer of 2022, Upwave customers began participating in a beta to measure walled gardens like YouTube, Facebook, Instagram, and Snap, replacing 1:1 identifiers and person-level ad exposure from the platforms with micro cohorts (zip-code holdouts) and deterministic control groups.
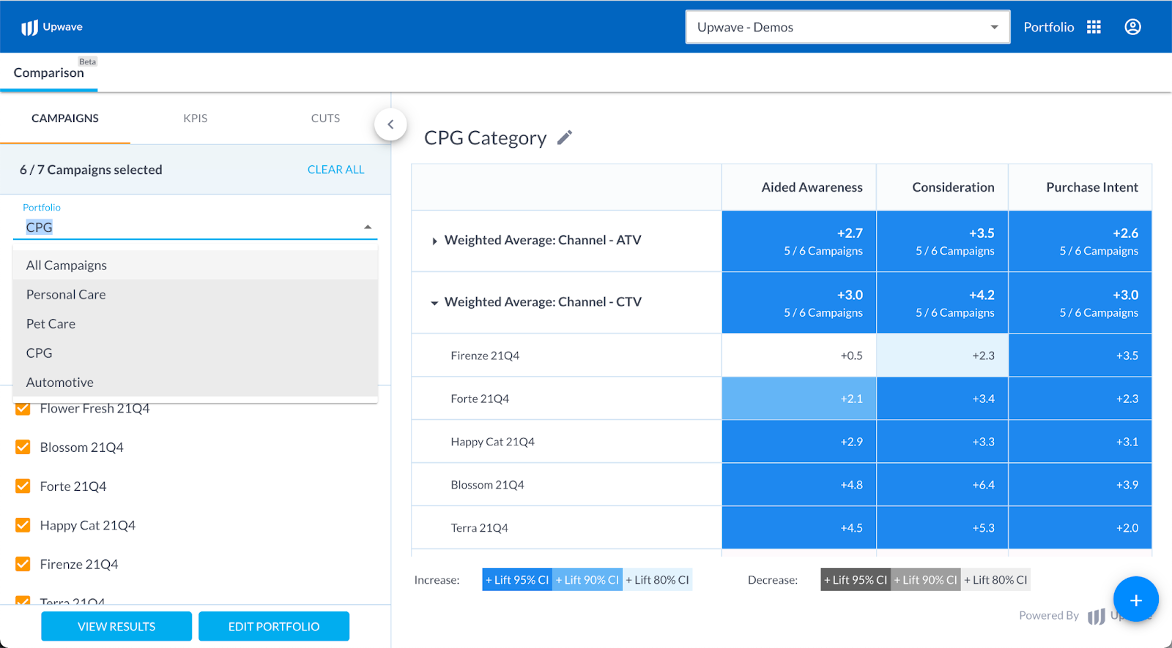
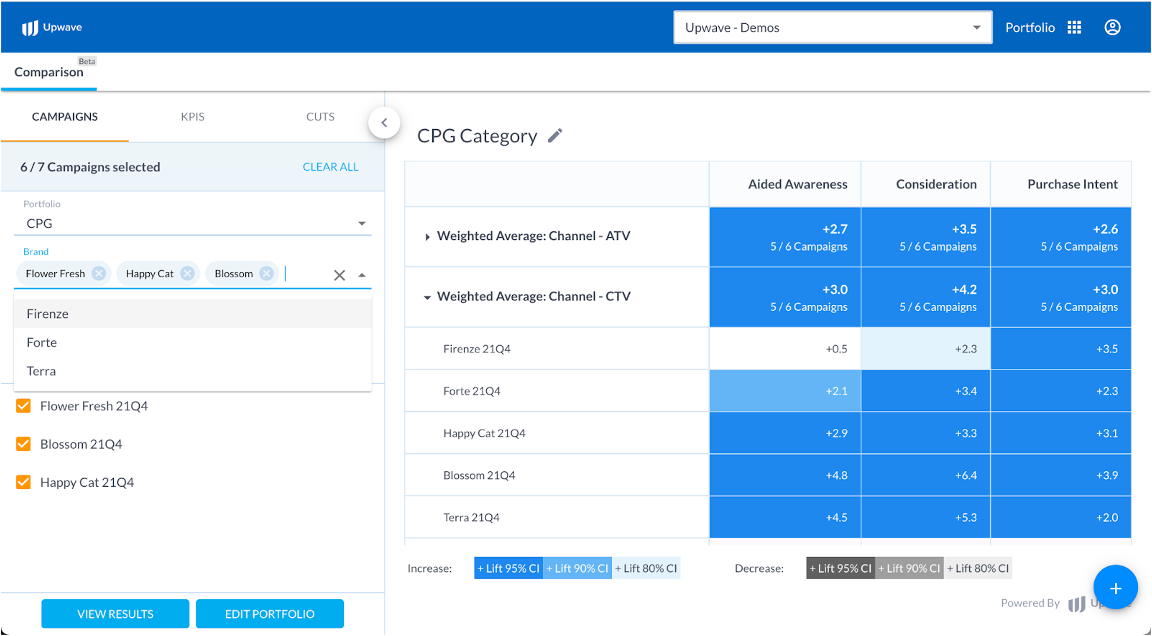
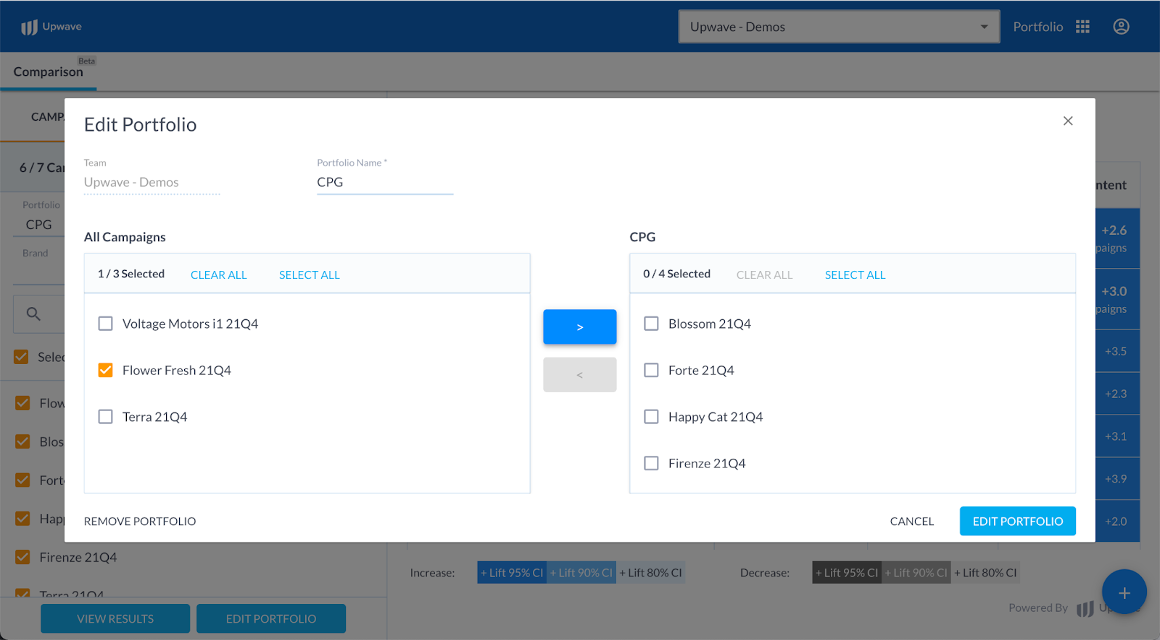
Benchmark by Campaign Categories | Upgrades to Portfolio Analytics
Comparing your campaigns’ performance and benchmarking shared tactics is so much easier when you can consistently group campaigns by brand, vertical, year and quarter, or in other ways that make sense to you. Earlier this year, Upwave introduced portfolios so users on your team can do just that – group your campaigns into portfolios, filter them by brand, add new campaigns as they go live, remove others as needed – giving you versatility and flexibility to make your measurement more powerful.