
As we explored in a previous post, Targeting Verification opens the black box of programmatic TV, enabling brands and agencies to finally answer the question: “Are we hitting the target?”
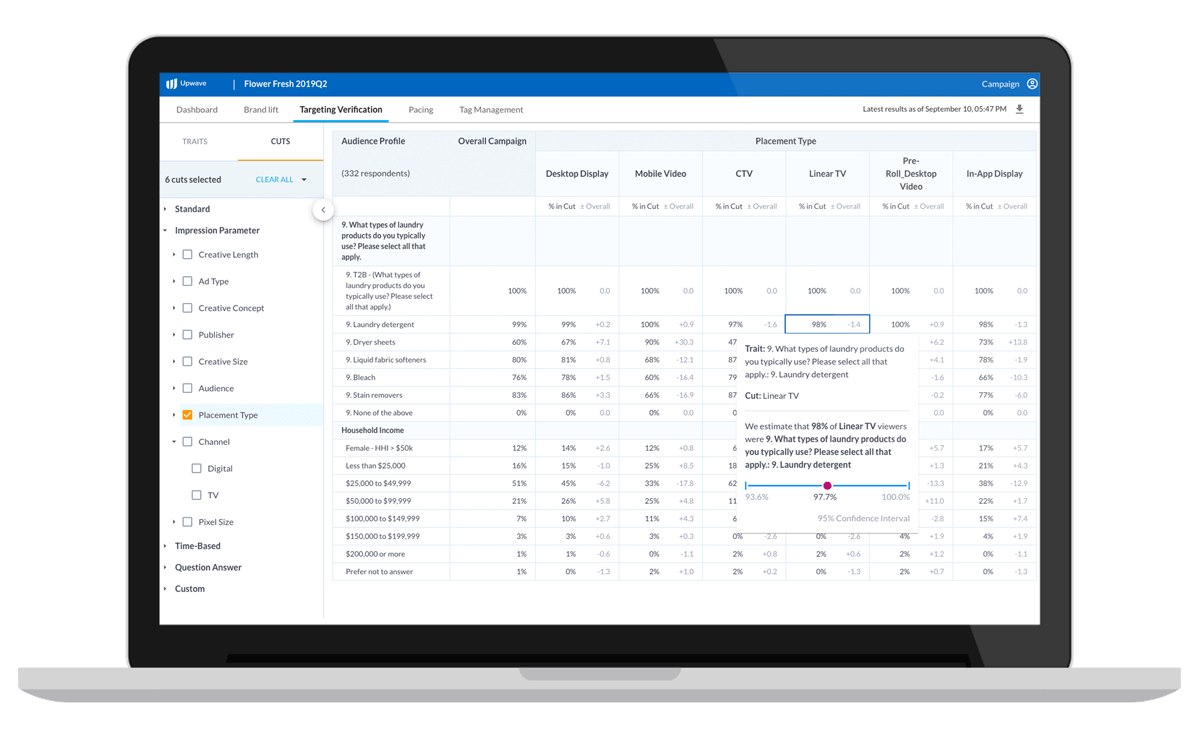
Using real attitudinal data and transparent statistics, the Upwave Targeting Verification dashboard enables marketers to confirm whether they are reaching their target audience when running on CTV, Addressable TV and any digital channel, as well as confirm the percentage of an entire campaign that truly reaches a specific behavioral and/or demographic segment across CTV, linear and digital video channels.
Verifying the degree to which you are reaching your target audience, though, is only half the battle. The task then becomes interpreting, and ultimately acting upon, those results. Are you over or under-indexing? Which parts of your campaign are performing well, and which need adjustment? Here, discover our framework to better understand – and apply – the insights gleaned from targeting verification.
HOW TO INTERPRET RESULTS
In order to interpret your campaign targeting verification results, keep three key things in mind:
Baseline Index
The “baseline” for an audience is the percentage of the total population that audience represents. The accuracy of a campaign’s audience targeting must be interpreted relative to the population incidence rate.
Let’s say, for example, that your targeting verification reveals a campaign is reaching the target audience 60% of the time. At first glance, that may appear to be a failing grade but a closer look is required.
If your target audience is “women” you’d be right. Sixty percent is little better than a coin toss.
On the other hand, if your target audience is hedge fund managers – a miniscule percentage of the population – 60% accuracy is remarkable.
Once you account for the degree to which your campaign over or under indexes relative to the population at large, you can turn your attention to the confidence interval of the results.
Confidence Intervals
Legacy platforms born out of broadcast TV measurement tend to downplay the importance of confidence intervals in reporting accuracy rates. In reality, since most digital campaigns target custom, brand-specific behavioral segments, knowing the likelihood that a sample of the people reached by a campaign matches the entirety of the campaign’s reach is critical to effective in-flight optimization.
Consider a campaign by a national paint brand targeting general contractors with an intended reach of 10 million people. After four weeks the campaign has reached 2.5 million people and, based on a sample set of 2,000 people, the accuracy rate is 2%. Do you adjust the campaign to increase accuracy or wait for more data? Without knowing the confidence interval it is impossible to say. If the 95% confidence interval ranges from 0% to 5% you will likely want to wait for more data before making adjustments whereas if the 95% confidence interval includes 1.5% to 2.5% you are likely in position to take action before more of the campaign has elapsed.
The larger the sample size, the more precise the measurement, and the more confidence in the result — but the longer you wait for data, the less time remains in the campaign. The Upwave Targeting Verification dashboard includes the confidence interval for all accuracy rates so campaigns can be optimized as early and effectively as possible.
Reach vs. Accuracy
The final element to keep in mind is the trade-off between reach and accuracy, especially when thinking about how to act on results. Most campaigns are run across multiple publishers or programmatic audiences and, naturally, the accuracy rate will differ between each one. For example, Publisher A may be targeting at an 80% accuracy rate whereas Publisher B may only be targeting at 40%. Without further examination, one would be tempted to increase the budget allocated to Publisher A. However, if Publisher A is a niche blog with minimal additional reach, the return on additional spend will be relatively low. In contrast, despite the lower accuracy rate, if Publisher B offers broader reach at less expense it could be more cost effective to increase budget there.
By understanding these three indicators, you’ll be better equipped to make campaign changes in real-time.
HOW TO ACT ON RESULTS
Interpreting targeting verification results is not simply an academic exercise. Using real time results in the Upwave Targeting Verification dashboard, you can shift budget to over-indexing audiences and publishers while balancing accuracy vs. reach and monitoring confidence intervals.
The optimization process isn’t a one-and-done operation though. It is critical to continue to monitor targeting accuracy after increasing budget because an over-indexing audience could begin to under-index as reach is extended.
It is also important to consider results in the context of KPI priorities. If brand lift is the primary campaign KPI, and media partners are under-performing on brand lift, look to see if they are off-target relative to baseline and, if so, use these findings to diagnose underperforming tactics and campaigns. If on-target accuracy is the primary campaign KPI, then use these numbers as part of the conversation between advertiser and media partners, whether as a currency or a negotiating lever, to emphasize the priority of driving lift within the target audience rather than the population at large.
CONCLUSION
Answering the question “Are we hitting the target?” is the first critical step towards optimizing campaign performance. The pivotal follow-up question, of course, is: “Now what?” By utilizing the Upwave dashboard, advertisers are able to understand the deeper layers of their targeting verification results in terms of baselines, confidence intervals, and the trade-off of reach vs. accuracy. Armed with this a deeper understanding, campaigns can be more effectively optimized and continually monitored to achieve desired KPIs.