
Traditional brand lift reporting displays multiple metrics – observed lift, statistical significance – that can each tell a different story, making it hard to know how to interpret and act on insights mid-campaign. The advice of research statisticians is generally to wait until determinations of statistical significance can be made with minimal risk of false positives or false negatives, which is typically at the end of a study.
This need to wait for statistical significance is a common roadblock to optimization of campaigns towards brand outcomes. And it’s not due to any inherent problem with statistical significance calculations. The fact that stat sig requires waiting until post-campaign to make decisions with confidence is a feature, not a bug, as we will see below.
But marketers shouldn’t have to wait to optimize when there is clearly data available. As we explored in a previous post, the problem is that statistical significance, while it answers one important question, doesn’t answer the question being asked during optimization.
Statistical significance answers the question: Is a tactic driving non-zero lift in outcomes? In other words, is a tactic driving any lift at all? This makes it the right metric for some decisions, but generally not for mid-campaign optimization decisions when the question being asked is this: Is a tactic helping or hurting the campaign? In other words, is a tactic lifting the campaign average?
The specific question being answered by statistical significance determinations has implications that also make it the wrong metric to use for optimization decisions.
Brand lift is meant to be evaluated once
Statistical significance is based on a statistic – p values – that is meant to be looked at and evaluated once – at the end of a study when the final data set has been collected. During a campaign, the data set is still dynamic as new impressions and outcomes are continuously being collected. When statistical significance is evaluated repeatedly in a dynamic environment, the chances that at least one of the statistical significance determinations will be a false positive or a false negative increases quickly. While the increase in these error rates is modest when evaluating two or three times whether a tactic is statistically significant, the increase in these error rates is dramatic when evaluating a tactic weekly, for example.
Brand lift does not compare tactics
Statistical significance does not compare the performance of two tactics — it compares the performance of those exposed to a single tactic to those not exposed at all, to know if the tactic is driving lift. So, a tactic may drive lift at a statistically significant level, but that does not mean the difference in lift between two tactics is statistically significant. For example, if tactics A and B yield brand lift of 7%, and tactic A is statistically significant while tactic B is not, that does not mean that tactic A’s outperformance of tactic B is statistically significant.
Brand lift and statistical significance do not always agree
The nature of brand lift and statistical significance calculations is such that frequently the two do not match as one might expect. It’s common for a tactic with a high brand lift to have a low level of statistical significance and vice versa. In such situations no conclusion can be drawn confidently as to how each tactic is actually performing. Take the following scenario for example:
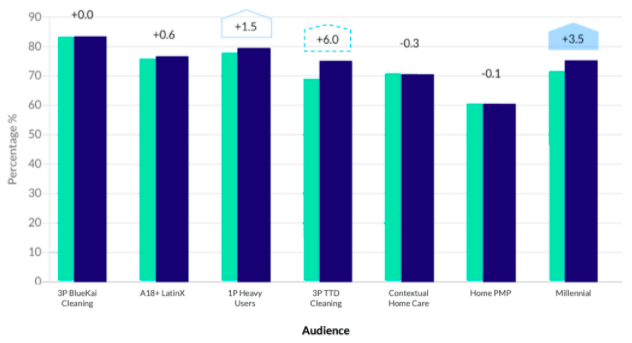
Well into the campaign, three tactics appear to be driving brand lift:
- The “3P TTD Cleaning” target audience shows an exciting 6.0% lift but statistical significance at a low, 80% threshold.
- The “1P Heavy Users” target has only 1.5% lift, but is statistically significant at a higher, 90% threshold.
- The “Millenial” target has lift between the other two targets, but is statistically significant at a higher, 95% threshold.
What action should be taken based on this information? Should you shift budget to “3P TTD Cleaning” to capitalize on the high brand lift despite the lower level of confidence or hedge your bets with the “Millennial” audience since the statistical significance threshold is higher? The traditional answer is to wait for more data but doing so means less time will remain to reap the benefits before the campaign ends.
Outperformance Indicators
Brand marketers need a metric that answers a mid-flight optimization question, not a post-campaign question. For mid-flight campaigns, the Upwave Optimization dashboard uses Outperformance Indicators to reveal relative performance between tactics rather than isolated performance of individual tactics. Outperformance Indicators combine observed lift and confidence levels into a single, sortable metric that answers the optimization question: How much confidence can I have that a tactic is helping the campaign, that is, pulling up the campaign average?
Consider the same campaign used above, for example, through the lens of Outperformance Indicators:
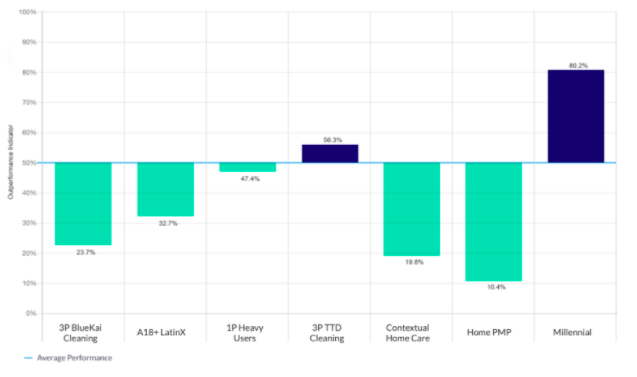
At a glance, it is clear we can be 80.2% confident that “Millennial” is helping the campaign but “3P TTD Cleaning,” which seemed so promising based on brand lift, in reality has only a coin-toss of a chance to actually help the campaign overall.
While brand lift statistical significance is appropriate for evaluating results at a couple of fixed points (e.g. mid and post-campaign reads) for reporting whether tactics are driving any lift at all, Outperformance Indicators help brand marketers make optimization decisions (such as reallocating budget or traffic between tactics) throughout a campaign.
In a forthcoming post we’ll explore the natural next question: How soon in a campaign can I begin making optimizations based on Outperformance Indicators?