
What’s New: Lift Trends
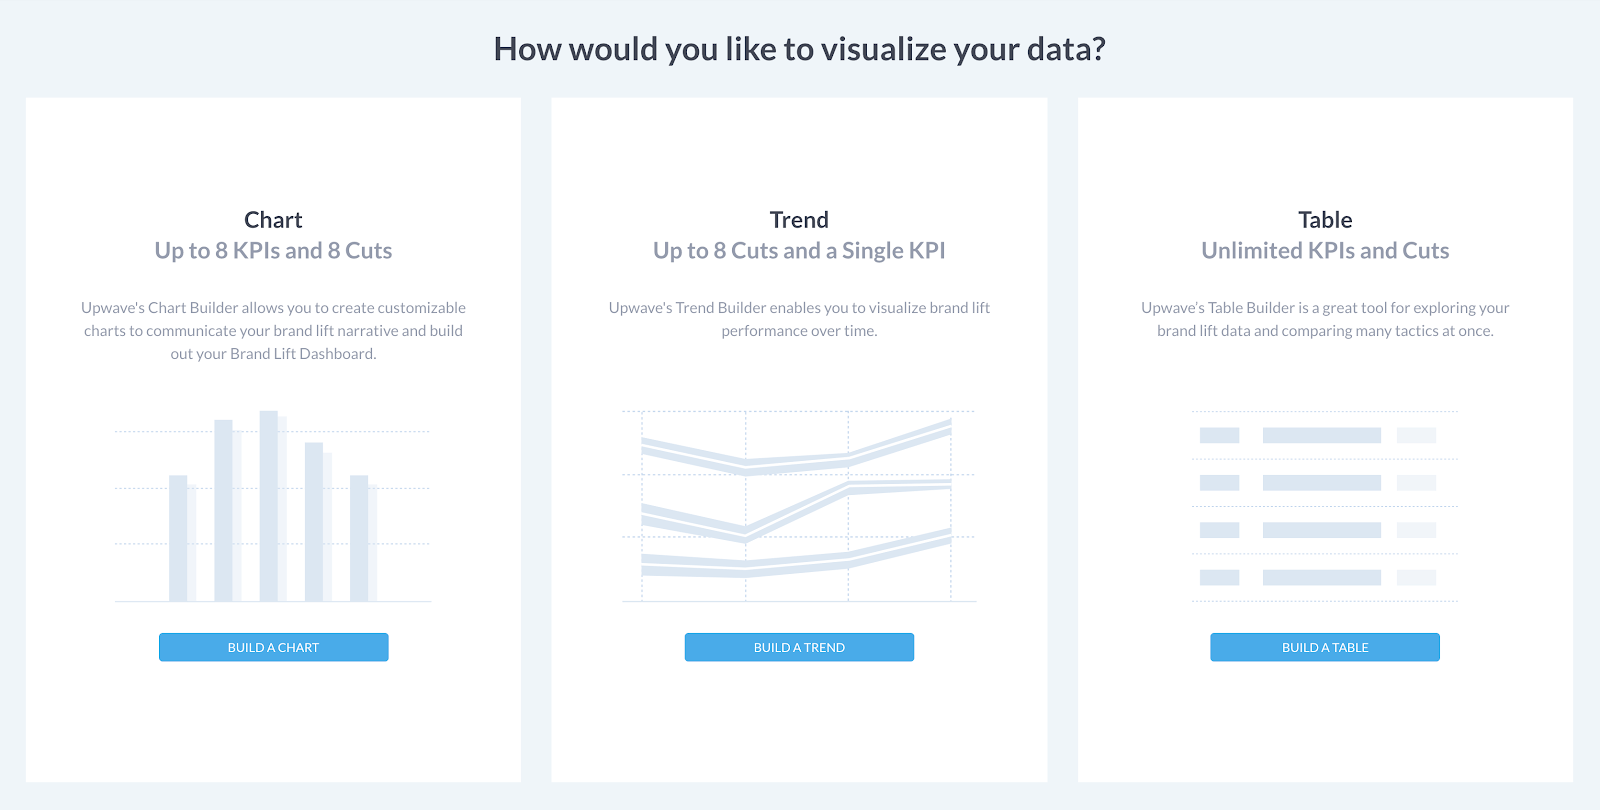
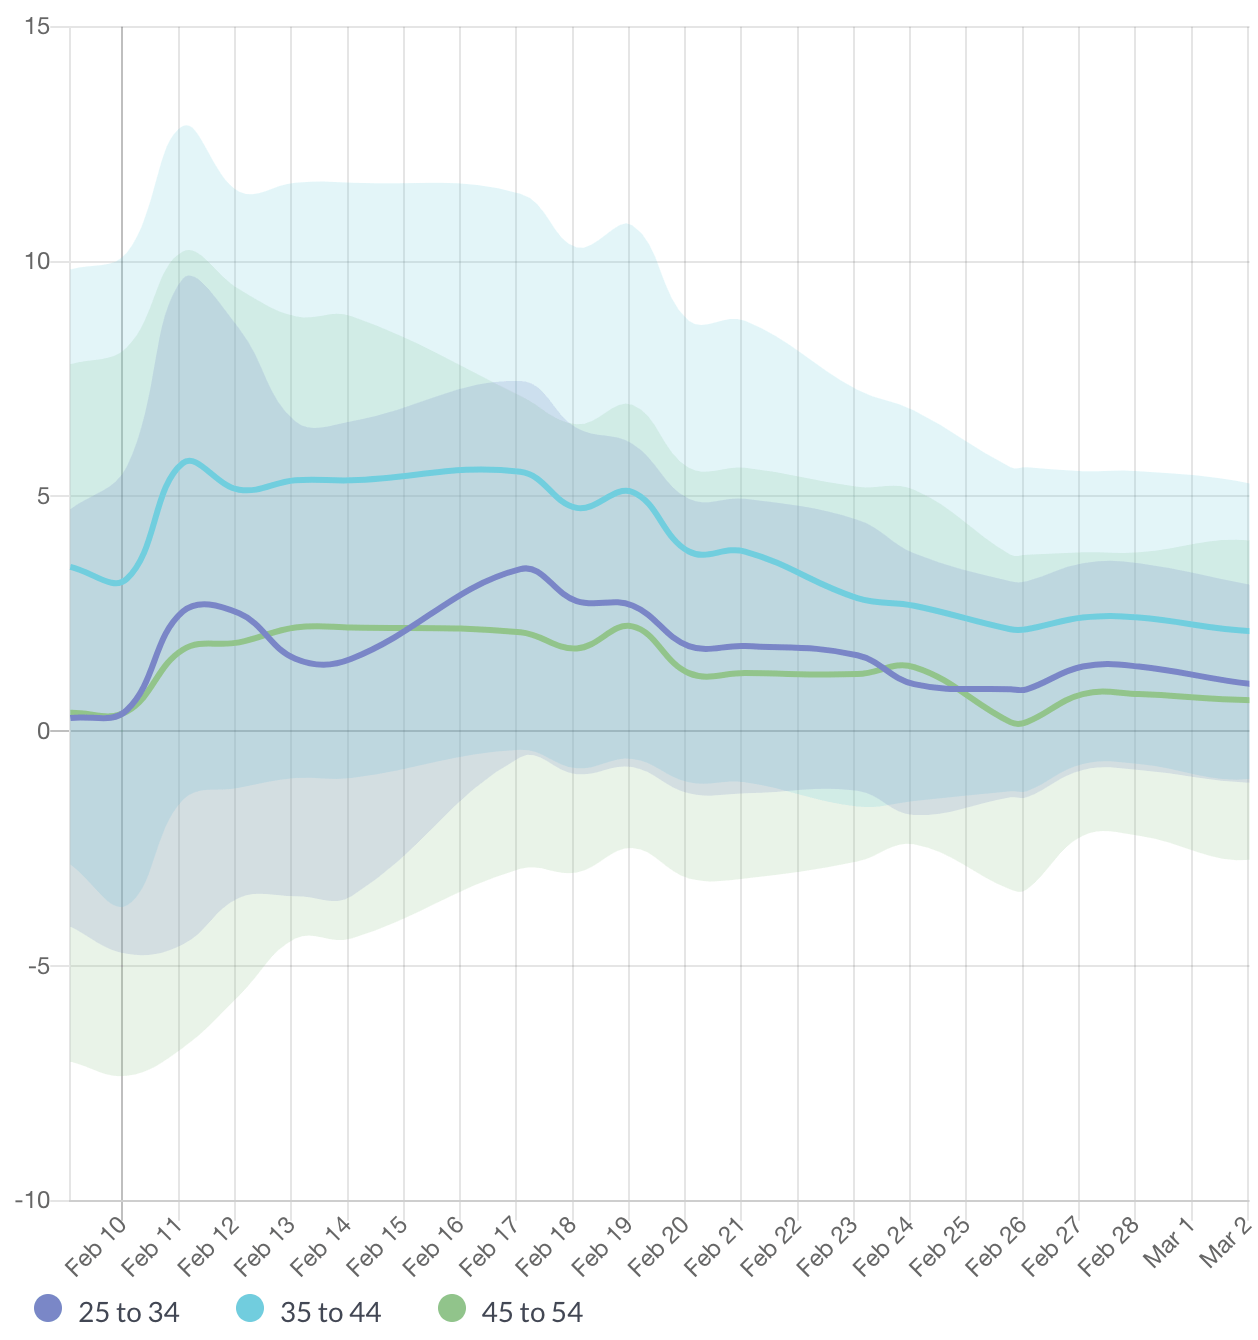
Upwave’s trends are versatile like charts and tables. They support multiple cuts for a KPI so you can compare relative performance over time…

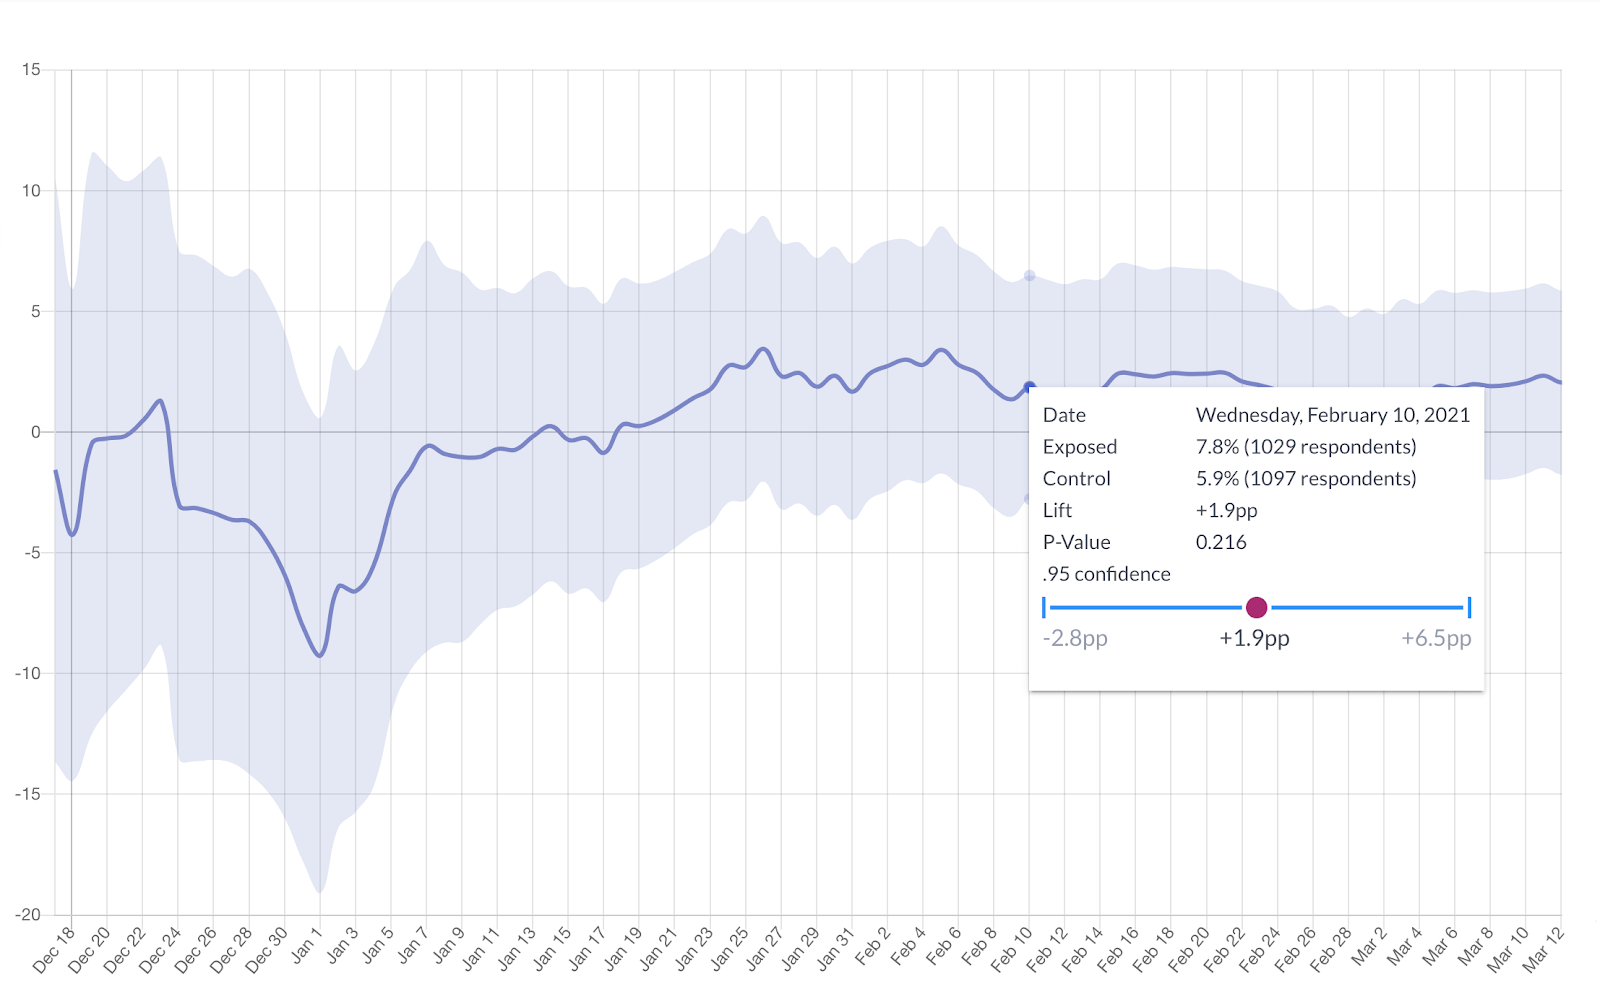
…and each daily point is annotated with detail that makes it easy to put the overall trend in context.
 Trend visualizes the increased accuracy that comes with data collection, as the fluctuation decreases and the margin of error narrows over time. In addition, the impact of optimizations that materially impact campaign-level performance can often be seen.