
Thanks to another update to Upwave’s platform, users now have the ability to visualize brand lift data in a tabular format using the new Table Builder tool.
After logging into Upwave’s dashboard, users will see the option to visualize brand lift data in either a chart or a table format.
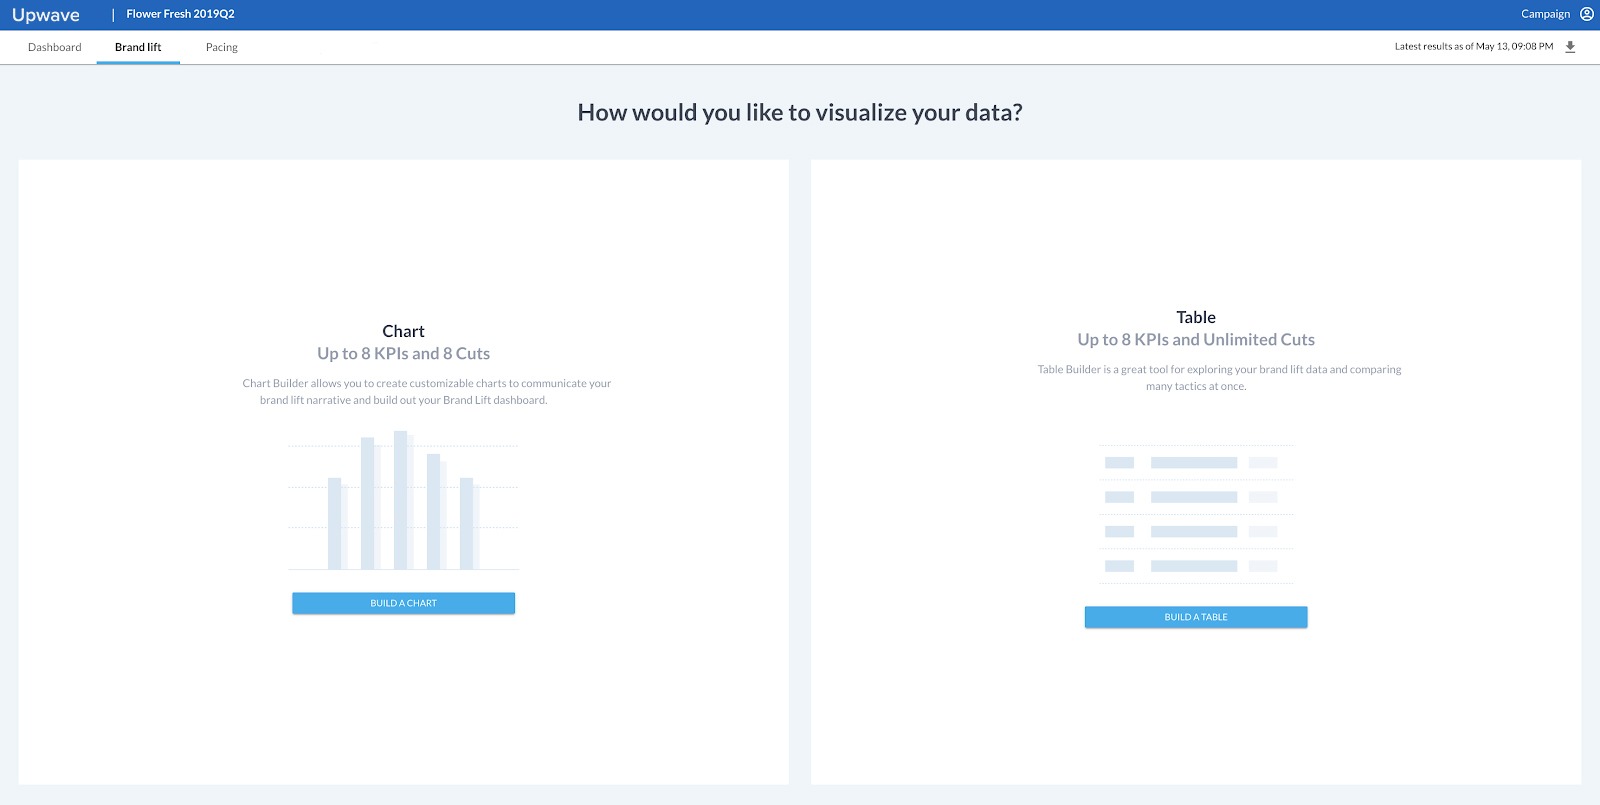
Upwave’s new tabular view is ideal for exploring large volumes of data, and comparing multiple tactics simultaneously.
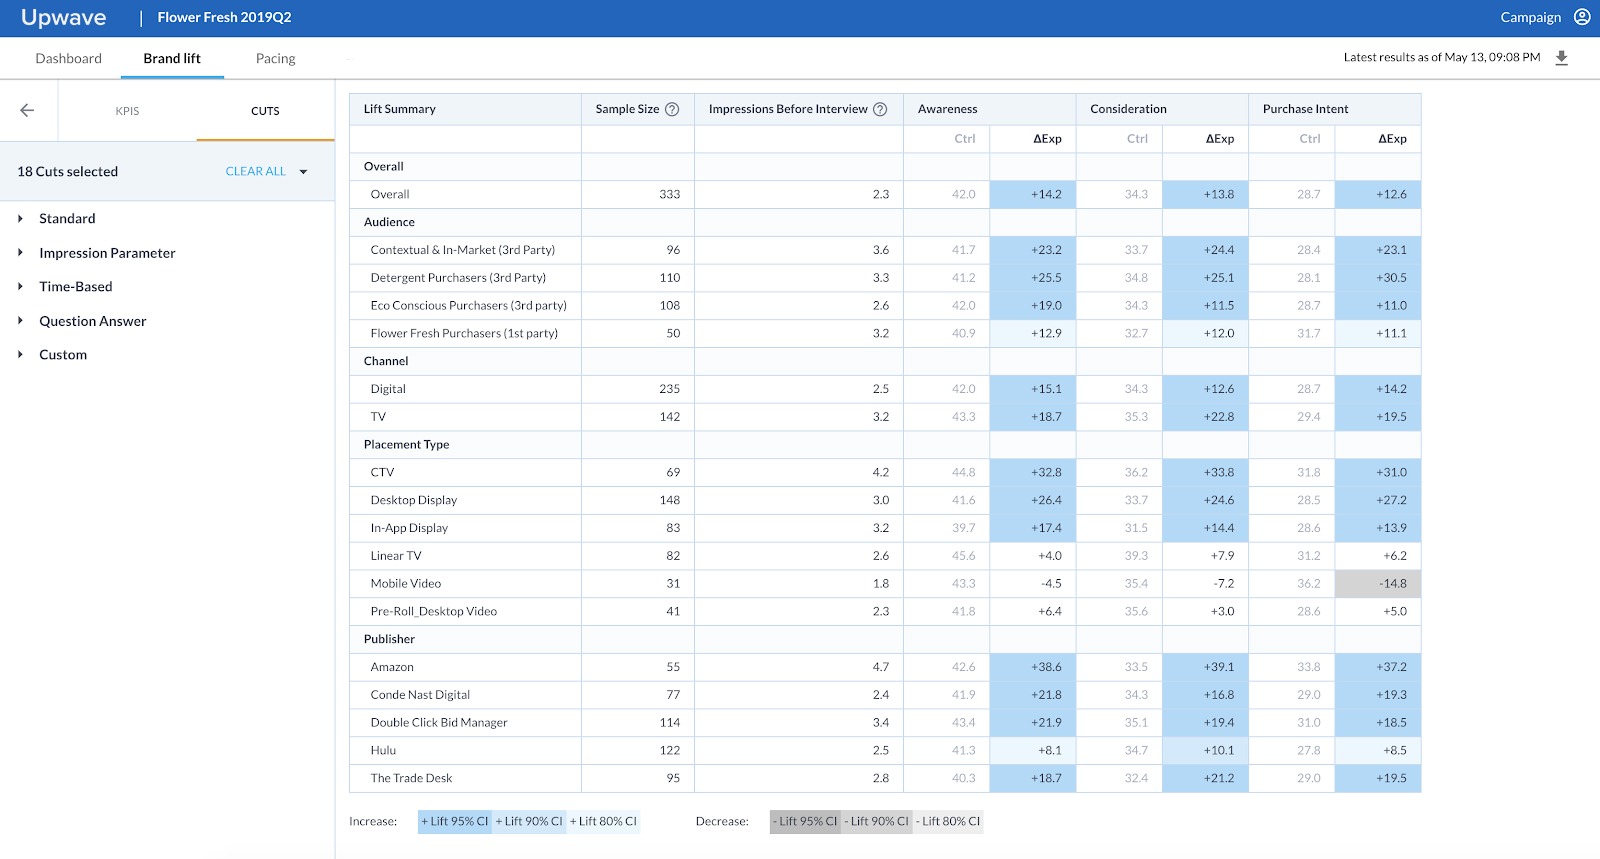
The interactions for creating a tabular visualization are the same for creating a chart view. Select at least one KPI and one Cut from the sidebar menu, and the table will dynamically update to match the selections.
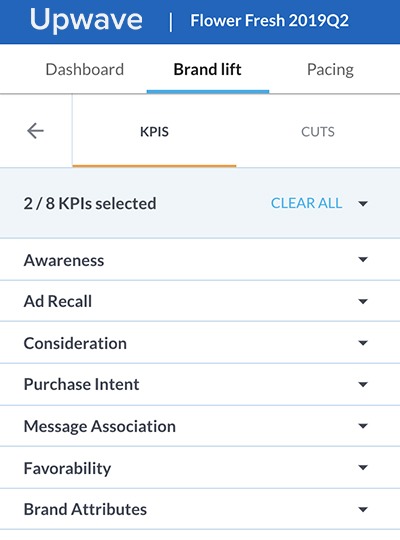
KPI Names Instead of Survey Questions
Another May 2020 update: One of Upwave’ss most frequent user requests was to display Brand Lift KPIs in terms of KPI names, not survey questions. Now, whenever users access their brand lift data in the dashboard, all standard KPIs will be labeled with their KPI names—only standard Upwave KPIs will appear with KPI names.
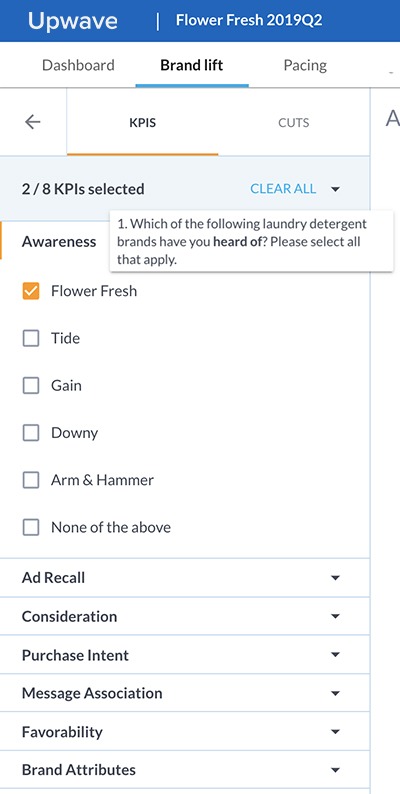
To view the original survey question, simply hover over the KPI of interest, then survey question will appear in a tooltip:
Single Sign-On for Platform Access
Another great update for May: Upwave now supports single sign-on (SSO)! For companies that use Google for SSO, simply login with Google.
Find out more about these new or updated features, or request a demo of the Upwave platform.